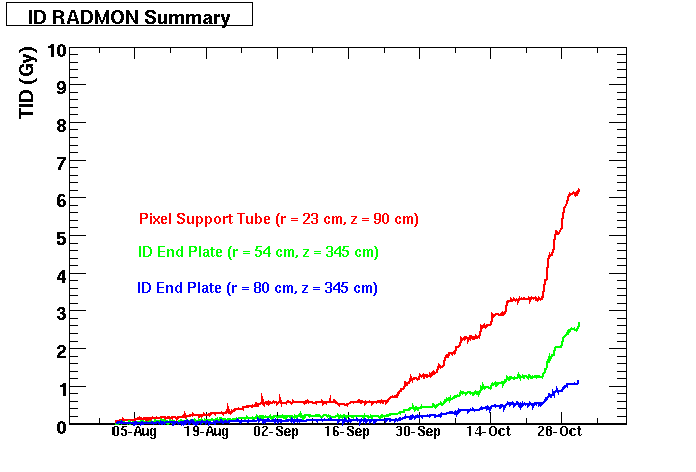
The
plot shows averages of measurements from several RadFETs
on three different sets of locations: Pixel Support Tube (4 sensors), Inner
Detector End plate at R = 54 cm (3 sensors) and Inner Detector End Plate at R =
80 cm (3 sensors).
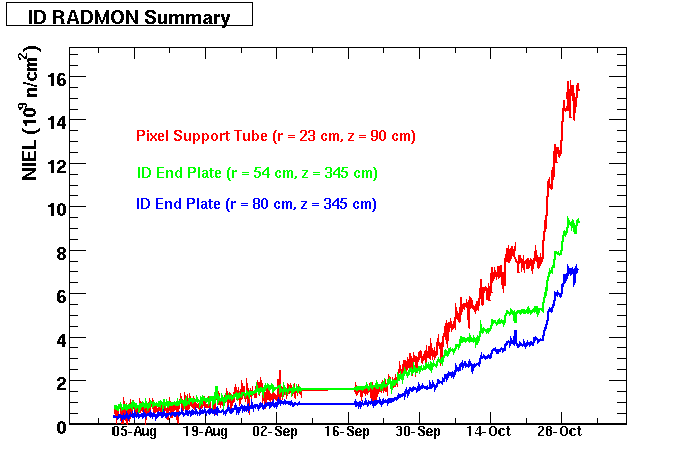
The
plot shows averages of measurements from several PIN diodes on three different
sets of locations: Pixel Support Tube (1 sensors), Inner Detector End plate at
R = 54 cm (4 sensors) and Inner Detector End Plate at R = 80 cm (4 sensors).
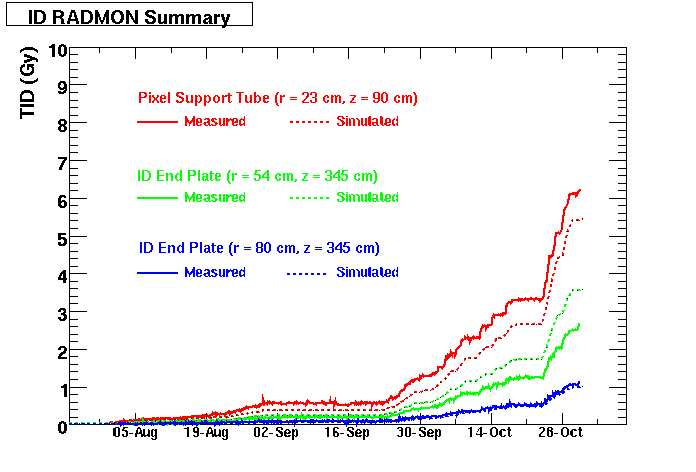
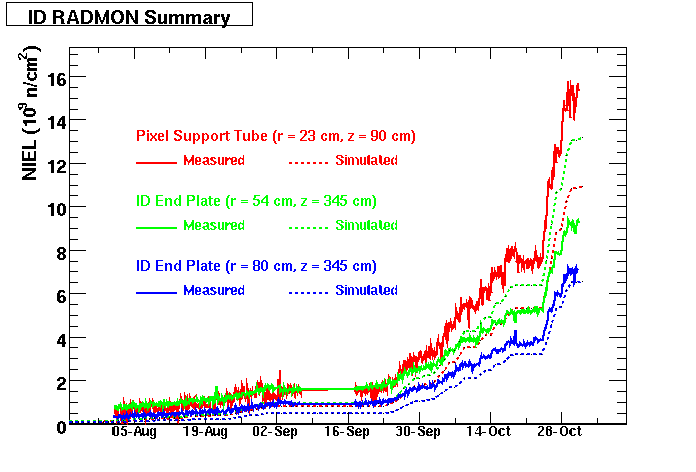
3.
Comparison
with simulation
Same
plots as above with simulation curves added. Simulated values are calculated from
integrated
luminosity multiplied by proportionality factors (Gy/pb-1
or 1 MeV equivalent neutron fluence/pb-1) from simulations
1. TID
2. NIEL
Recent doze and fluence summary
plots are available here